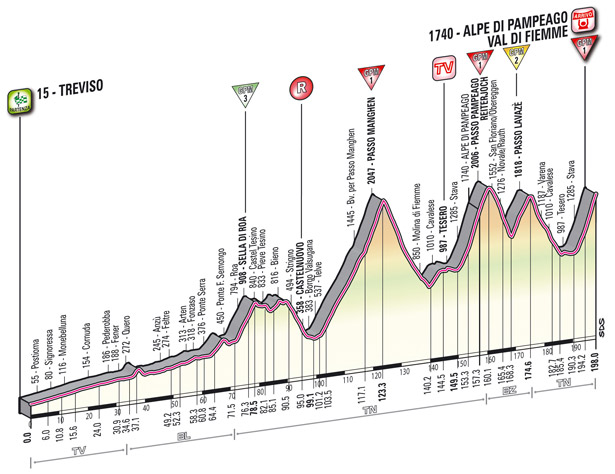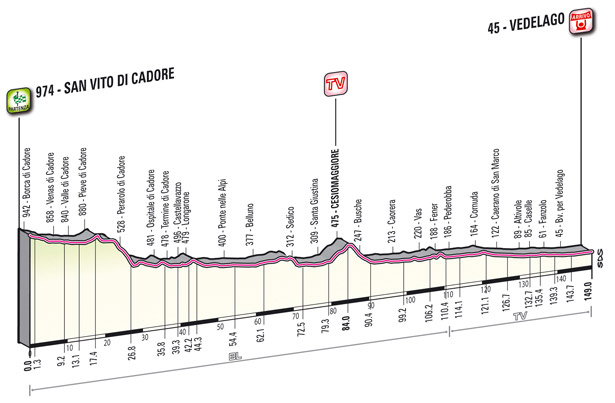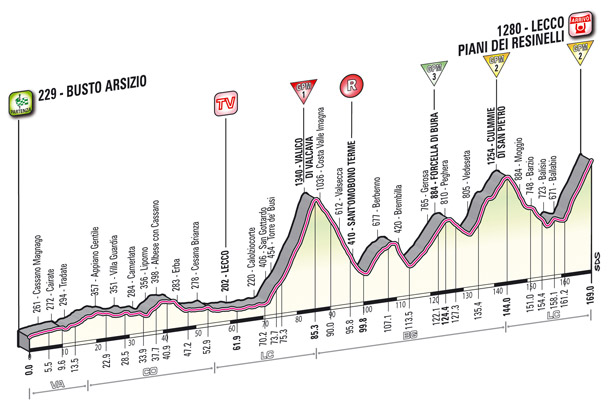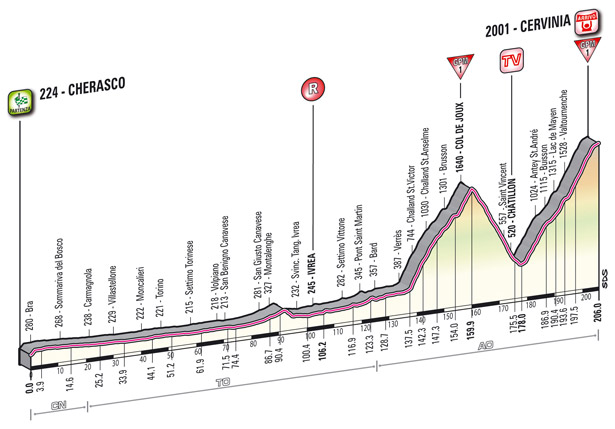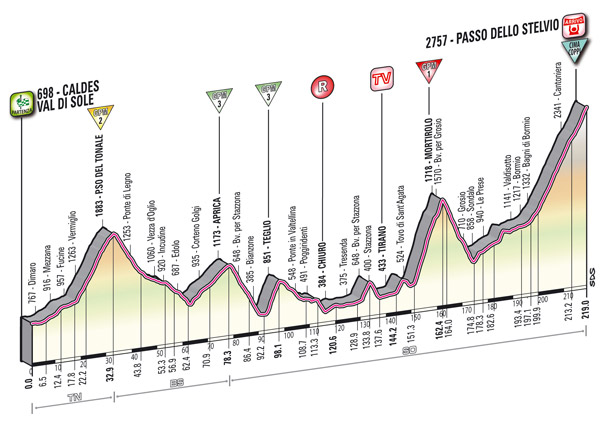
We’ve all seen the cross-section stage profiles used to depict the route of a race. For example here’s the graphic for the Stage 20 of the Giro from Caldes to the finish on the Stelvio, one of the most mountainous days of the season.
These graphics image slices across the countryside to produce a representation of the landscape, to show where the climbs come. But they’re not to scale. If you look at the image above it shows a stage that is 219km long in the horizontal scale but the vertical scale peaks at 2.75km. The Mortirolo looks like a cliff rather than a one-in-ten road. If a stage profile was drawn to scale what would it look like?


