

The Economics of Professional Road Cycling – Sports Economics, Management and Policy 11, edited by Daam Van Reeth and Daniel Joseph Larson
Money makes the wheels go round and this collection of academic papers is a study of the business and economics of pro cycling covering topics from revenue sharing to exploring how many, or rather how few, actually watch the sport on TV as well as the Game Theory of breakaways versus the peloton. You won’t read this for distraction and escapism yet the analytical detachment means this brings a fresh perspective on the sport that makes it a compelling if serious read and a useful reference if you want to explore this topic. Just know from the start that this an academic journal and priced high.
This is a collection of academic papers with different subjects from measuring the TV audience, anti-doping to sponsorship analysis. A chapter on TV audiences sets out just how hard it is to know how many people watch a bike race. There are boasts of billions watching the Tour de France but catching a 12 second clip on a news broadcast is not the same as an audience watching the race live. According to Van Reeth as little as six million people across Belgium, France, the Netherlands, Denmark, Spain, Italy, Australia and the UK could be watching the Tour de France live on a midweek sprint stage with an equivalent audience for the rest of the world. For all the boom in the US, UK and other anglophone nations the combined growth in viewers remains a fraction of the drop-off in the wake of German TV’s withdrawal; the resumption this year of Tour coverage is tentative for now.
One chapter looks at the roles of rider agents and is a factual and legal analysis of the current situation with intel on the typical rates charged and the roles of agents including a matter-of-fact take on the regular rulebreaking of UCI-registered agents.
Another chapter is more analytical as it ventures an economist’s take on race strategy, essentially the Game Theory of cycling tactics with explorations of “backward induction” and “Nash equilibirums”. Even scenarios when we think there are no tactics, like a time trial, have strategies in place. After all most riders in a TT stage of a grand tour is it as an active recovery session or a pacing effort to beat the time cut while we’re normally worrying about the strategies of the few trying to win the stage or contain their losses on GC. Still for all the analysis, reading this chapter doesn’t offer fresh tactical solutions, it simply provides a structured explanation of cycling tactics, even an algebraic framework.
A look at globalisation covers the spread of the sport. Is the peloton more international? Yes and this sets out data along with the terms “homogenous internationalisation” and “heterogenous internationalisation”. Management-speak jargon? Yes but also a concise label for the ememergence of teams from new nations versus the idea of existing Euro teams hiring riders from a more diverse set of nations.
One strength is the leap away from the sport and the use of analytical tools normally applied elsewhere. For example how do we measure team performance in pro cycling, an individual sport practiced by teams? It’s rare in sports but step back and just the same problems apply to other domains. Just look to politics where a individual candidate must win a presidential election but relies on a campaign team effort; to finance where a fund manager may outperform the market aided by research from colleagues. As other fields matter more they’ve been studied more and these tools can now be applied to cycle sport. This doesn’t bring magic results but it provides a feast of food for thought.
It’s also a manual you’d give to an alien who wanted to know what bike racing was about once they’d grasped there’s more to it than the fastest rider between the start and finish. At the same time this is analytical in the way you could break a 747 Jumbo down into its constituent parts: you’d understand things about fuel injections, upholstery and gas turbines but it’s not the same as watching in awe as 425 tons take off nor hitching a ride. As you might expect the theory can trump practice, one part of one chapter to improve anti-doping exploits rational Game Theory concepts but relies on assumptions that are, to be generous, optimistic. Still it’s a clever idea and good to explore. But this is rare, most of the journal seems sensible and highly practical.
The Verdict: if like your cycling literature as a means of escapism then avoid. This is dry, academic and loaded with data, jargon and analysis. That’s the very brilliance of this, a full house of analysis and research on the pro peloton that’s often so packed with detail you’ll read a page and then read it again in order to help soak in the content. Some chapters flow better, this is not a page turner for the beach and it stands as a useful central reference for all the sources it cites, this blog will be mining it for months. It’s of interest to anyone who wants more on the business topics of pro cycling and a vital tool for those working in this field. In fact it’s almost reserved for this kind of audience as it’s priced for university libraries and professional subscribers and a single copy will cost you close to €140 and the ebook is €110.
Sports Economics, Management and Policy is a journal published by Springer, www.springer.com/series/8343
A PDF of this was sent for review. More books reviews at inrng.com
Thank YOU for reading this… so I don’t have to! I mean this. You’ll throw out interesting nuggets mined from this thing for years while your audience doesn’t have to wade through it. Cold, hard, academic analysis can be great to get folks to take a step back and look at something like sport with a more wide-ranging view. Pro cycling certainly needs it. The sport’s in its current state due to way too much short-term thinking on the part of most organizers, participants and governing bodies.
Thanks for this, I totally agree with Larry I am sure there are several debatable points in the reports. Just to bring up one. I have seen TV viewing figures for the TdF (source.France’s Nationalized Television) quoted as 50 million in 1980, rising to 1 billion in 1986 due to the development of international communication satellites. That may well be incorrect, but it does place the important question of viewing numbers into some perspective. Viewing figures are certainly important to sponsors, and the numbers need to be known. I know it is an almost impossible task with cheap skates like me viewing via pirate feeds to avoid some of the worst commentators. BUT a reliable estimate for the numbers viewing the major events would be extremely helpful. From the figures quoted there are no references, so presumably they have been derived mathematically somehow by an academic based on exactly what ?
so that would seem to pour cold water on the ‘Sky pays 30m/yr, but get 500m worth of exposure if they win the TdF’ theory that gets bandied about…
with a gbl audience of just 6m on some days, I’d imagine they are made up of mostly diehard-cycling-fan types, and that would hint that the bike manufacturer/sponsors maybe get best bang for their buck…
It was rumored that Verbruggen was not terribly interested in “globalizing” the racing itself. Rather, pursuing global audiences to European events to which Verbruggen at least controlled the media rights.
It seems “the internet” has helped raise audience numbers, but that is likely true for all sports. For all the changes made over 30 years I’ve followed the sport, it seems like the audience is about the same.
This book is on my reading list!!
Don’t muddle any numbers thrown around for tv audiences for the Tour, with the overall brand exposure and associated value. The latter absolutely does not hinge on the former.
For me SKY’s in the “rich chamois-sniffer” category of sponsor. Isn’t Murdoch’s son James the one who got them into the sport? The loot they throw in as sponsors to the team has been characterized as a “rounding error” in the annual budget.
Not quite true. Yes, James Murdoch is a keen cyclist, but Sky were looking for a sport in which to invest sponsorship in both the professional side but also the grassroots and leisure side, and cycling ticked boxes like family-friendly, healthy, accessible to all etc.
The sponsorship on the professional side started with the GB team and the build up to 2008 Beijing Olympics. That was so successful, they were all ears when Brailsford pitched the road trade team idea to them.
The question of TV audiences is critical to understanding the overall value of the papers presented. One assumes this collection of papers are of sufficient standing to all have been peer reviewed. At present only INRNG has this information. I only raised the question of numbers because it stood out to me as being at odds with other data I had seen.
As Larry T has stated. Any ideas which potentially takes the sport forward are to be welcomed, but the facts have to be correct to ensure that discussion and any decisions subsequently taken are based on reality.
The audience assessment, as related by inrng, looks like *dubious*, at least if we’re speaking of very recent years. In 2015, in Italy, the least watched stages were the first and the last, 1.4 and 1.0 M spectators respectively. Hence, no “mid-week sprinter stage”…
The rest of the race remained steadily between 1.5 M and 2.0 M during the first ten days, and raised about +0.5 m during the last ten stages (with a top at 3.1 M on Alpe d’Huez). The stages you may define as above collected about 1.5 M spectators. In Spain those same stages collected around 1 M, and the audience peaked around 2.3 M.
I struggle to imagine how you might arrive at a total of 6 M when – in Italy and Spain only – you’ve already got 2.5 M viewers. Who’re following the final hour of the stage at least, no need to be said, no 12-secs break.
To start with, I’m not as sure about France, but I’d say that, for instance, both Amiens and Fougères collected about 3 M spectators. That would bring us at 5.5 M… What about Belgium? And the Netherlands? No UK spectators for Cav? In Germany they still have Eurosport, don’t they? Denmark, Norway, Switzerland? And we didn’t even start to look outside Europe.
No, I can’t believe such figures. At least, as I said, as far as 2014 or 2015 are concerned. And I could look farther back, I don’t think things would be that worse in the last 5-6 years or so.
I need to underline that we’re speaking of “mid-week sprinters stage”, which is sort of a flawed perspective in itself, IMHO. Peaks and averages are perhaps more interesting.
You don’t explain how the Italian viewing figures are calculated, or where you sourced them from. As INRNG said, “There are boasts of billions watching the Tour de France but catching a 12 second clip on a news broadcast is not the same as an audience watching the race live.”
That’s the nub of the argument about how many people actually watch the races.
Since I’m not writing an academic essay (you’d had to pay to read that), I believe you may trust me or not. As simple as that.
Leaving aside that petty detail, I can tell you, just to satisfy your curiosity, that they’re official figures by the Italian audience-measuring service (Auditel). They’re public, and get published the day after the race. They’re calculated – just as pretty every viewing figure in the world – thanks to a real-time recording system on a relevant sample of households. There are different kinds of audience measurements, but these, in particular, are figures produce by average, which gives you an estimation of the “stable viewers” who’re in fact watching the last hour or so of the stage (length may vary, but it’s usually somethink like that, from 45′ to 90′) , which is labelled as a TV program on his own (“Giro/Tour all’arrivo”) in order to measure how many the *specific* or *really interested* spectators are.
The inrng quote you report is quite OT, as I had explained above. We’re speaking of *people* who *actually* *watch* *the race*, here, the rest is a quite interesting while totally different subject.
Thanks Inrng,
Appears we have some more homework to masticate on.
Statistically,I would be interested in knowing if the report analysis points to possible different socioeconomic groups following the sport, in the different country markets. Is the profile of an Italian fan different then that of and Australian fan?
Yes to your question but that’s not in this piece.
There is an interesting article on this, and television coverage of cycling, on The Outer Line site opposite – “Kill Your Television” (I couldn’t copy and paste the link for some reason).
It does also mention the high cost of covering races.
All this begs the question, just how few viewers are tuning in to a standard mid-week one day race ?
Less than a million ?
Eurosport is oft-maligned but we’re very lucky to have it at all, I would say…
UK spectators? Even on a stage probably most interesting to UK residents something like 4 million http://www.cyclingweekly.co.uk/racing/tour-de-france/four-million-itv-viewers-tour-de-france-stage-two-finale-130576
Seems a lot! I heard a figure but cannot remember where from that ITV4 were happy with 400,000.
Here is a bigger picture view from BBC that kind of looks at the bigger numbers sometimes quoted http://www.bbc.co.uk/news/blogs-magazine-monitor-28264183
I love watching it but I have to admit if you are not a fan it can be a little dull especially when live (sorry).
UK Channel 4 highlights packages from the 80’s with about 23 minutes, some scenery and blather I could even get my wife to watch. Hour long higlights now, no chance.
Re. viewing figures, speaking from a tiny bit of experience running ads as a marketing person the fact is that all viewing figures have a strong pinch of voodoo in their calculation. I wouldn’t know how the authors arrived at the figures but it’s probably safe to assume that each territory will use a slightly different methodology.
The quality (and repetitious nature) of the ads on (British) Eurosport suggest quite strongly that even for TdF the cycling viewing public is tiny, albeit reasonably well off.
The value to a winning team, however, can be quite high. Talking of advertising equivalent value is generally discredited in the PR industry these days, but for Sky to win the Tour will have been very valuable domestically in the UK,in terms of both brand awareness and brand value. Ditto Movistar and Tinkoff, though for Sky it is even more of a bonanza because they won with a Brit.
Bora, a revolution in the kitchen! is stuck in my head
I would love to read this book, by the way. A shame it is so prohibitively priced, but there again I supposed its destined for university libraries.
*it’s*
For those who understandably baulk at the high price of academic publishing, there are ways to access the content for less money and/or free.
An abstract/overview of the whole book is here – https://lirias.kuleuven.be/handle/123456789/476686
The book’s page on the publisher’s website is here – http://www.springer.com/gb/book/9783319223117
Individual chapters have free abstracts and sample pages. They are available to purchase for less than the price of the complete book.
Individual authors may well place their chapters on their own websites or on sites like Researchgate in time. Full texts will then be available as PDFs for free. GoogleScholar will find them.
If you are bold or cheeky enough and can show good cause, a direct contact with an individual author may get you a PDF by return of email if you’re lucky.
There are ways to access the book for less money than the full academic publishing price.
Individual chapters are available to buy on the Springer site and, with luck and in time, individual authors will make available their own chapters as freely available PDFs via their own websites or the likes of Researchgate.
Abstracts and sample pages are already freely available for the whole book and all individual chapters.
I’ve updated the piece above following an email from Daam Van Reeth. The audience data show as few as six million for a core group of countries, not the whole world for which his estimation is 10-12m but the 2014 Tour had low viewing figures compared to 2015.
As you can imagine, that wasn’t the case in Italy, where the 2015 Tour stages averaged 89K spectator less, even if peaks were higher in 2015 (I’m excluding the last stage which result was, obviously enough, abnormally high in 2014: including that the average would be 154K less in 2015, but that doesn’t make sense from a methodological POV). In Spain the results were quite similar: better peaks in 2015, especially when the race was broadcast in TV1 instead of Teledeporte, but not that different an average (albeit better in 2015), nor – what’s most important now – less spectators in the least watched stages.
Let’s go and see what about the mid-week sprinters stages, say, stage 3, 4, 6, 12 and 19. In Italy the first two scored 1.5 M viewers, then 1.6 M and finally 1.9 M and 2.1 M. In Spain the same series goes 1 M, 1.1 M, 0.9 M, 1 M, 1.1 M (we could add or not stage 7, depending on the fact that you consider it a sprinters’ stage or not, but it got a fine audience anyway, like, 1.7 M + 1.1 M).
What I see here is that both in Italy and in Spain we got from 2.5 M viewers on, also in 2014. I’m not including the first and the last stage of the whole Tour, being weekend and since they show greater fluctuations (up or down).
Let’s move to France. I can’t find the figures for every single stage, but we know that the first week averaged 3.5 M. We can reasonably imagine (extrapolating from the trends in the other two countries) something around 2.7 M for stage 3 or 6, the least watched ones in Italy and Spain. Which, once again, forces us to believe that Belgium (!), Netherlands (!), Denmark, Australia and UK, all together, couldn’t make 0.8 M? Not reasonable IMHO, even if I don’t know in detail those markets.
Let’s go a bit deeper into the French data.
Was 2015 that better than 2014? Yes, but slightly. The average was 3.5 M against “more than 3.4 M”. The share was 33% against 32.1%. The highest recorded peak was slightly higher in 2014, 7.2 M against 7.1 M.
What’s most interesting for the present debate is that the first week recorded better audiences in 2014: 3.5 M versus 3.2 M.
We must also consider that the general figures are an average between France 2 and France 3, which broadcast the first part of the stages (I think). In 2014 it was France 3 which scored particularly low numbers (-0.5 M), which means that if we only considered the final couple of hours on France 2, probably the difference between 2014 and the other editions would be even more reduced.
Uhmmm, ok, I could find an open copy with the pages of the article and… mystery solved.
There are troubles with the data.
More specifically, the Italian data are totally wrong. I guess they didn’t get what was happening with the double broadcast on both Rai 3 *and* Raisport 1 or 2.
It’s not like France where, if I got it right (I’m not sure), France 3 shows the first hours of the stage, then they go on broadcasting on France 2 for the finale. In Italy Raisport 1 or 2 goes on broadcasting during the last couple of hours while Rai 3 is doing the same, thus both channels are showing the same images to separate viewers, and you obviously have to sum up the figures. To complicate things, last year it was Raisport 2, this year it has been Raisport 1. This way the Italian data presented in the article are lacking of about 0,8 M viewers, on average.
However, the crazy Italian TV situation doesn’t justify the mistake, IMHO. In an academic article, if you reduce your scope to 8 countries or so, you simply can’t get one of the main countries wrong (the first after France, in terms of absolute number!).
And you should notice some anomaly in your data, like, I don’t know, some vague perception of reality that tells you that it’s quite strange that an Italian guy makes the podium in the Tour, then wins the bigh show, and audience figures go on decreasing and decreasing… (that’s because more and more spectators gradually become aware of the existence of RS2, and – above all hardcore fans – start to watch all the broadcast there).
The worst thing is that this error affects the analysis quite significantly: an 80% shift in your audience data also influences heavily what you observe about the share of spectators as a percentage of total population. To focus on total population as the reference and not on total viewers (the traditional concept of “share”) is highly debatable, but I won’t discuss that now, even if I’d suspect that some distortion might be introduced when countries with less population are examined. Even considering the method chosen by the author, Italy in 2014 finds itself well over the 2% threshold the author comments about later – at 3.44% to be more exact.
With that in mind, the final discussion, when a historical trend is examined over 6 countries (different from the 8 studied in the first place), makes little sense. Two out of three of the most important countries in terms of absolute number of viewers have been excluded, or, if you prefer, two out of the five with the highest share of total population watching the race.
Accidentally, both countries have recorded a trend of significant increase of spectators in recent years, which might overturn completely the conclusions to which the author jumps in the following paragraphs.
Something should also be said about the reflections about broadcast length. In the case of Spain nor is the broadcast so short, nor the audience data are referred to the last part of the stage. Not in the last couple of years, at least. In Italy you’ve got long hours of broadcasting, but the data are indeed referred to the last hour or couple of hours. It must be said that the data the author decides to use for France do follow a similar logic, since the figures from France 2 have been chosen, not the average that is as well offered by France Television (see above). But I won’t enter into this, either. What’s interesting is that the author doesn’t look like to be that much aware of the problem, hence I’m not very sure that he applied the right comparative perspective to Belgium, Netherlands and Denmark (how are they producing their figures?).
Anyway, this is barely relevant when compared with what I’ve been discussing above. And I must say that I really appreciate the idea of an academic approach to the subject.
I’d love to read more from the book (even if I’m worried some comparable mistake might be found in pages 110 and 111, not available in the preview 😉 ). In the same article I’ve been discussing here, I really liked some observations about the German situation, among many other things (maybe some German reader won’t agree, that’s life, I guess). I just entered into this because despite what inrng had pointed out afterwards, the figures still didn’t work for me.
Ok, I’ve written at least some absolute nonsense:
“What’s interesting is that the author doesn’t look like to be that much aware of the problem, hence I’m not very sure that he applied the right comparative perspective to Belgium, Netherlands and Denmark (how are they producing their figures?)”.
I hadn’t read page 107 at all, yet. Darn preview. Very sorry for my lack of trust, and beg the author’s pardon. Obviously, if comparable fatuities are to be found elsewhere in my reply, feel free to rub it in. Well deserved for my attitude.
So now, are you saying the author seems to take a consistent approach to the length of viewing time considered in each country but that overall his analysis of TV coverage is fundamentally flawed because of a failure to take account of overlap in numbers regarding channel duplicated coverage and that he seems to have been weak in logic-checking the numbers?
@CM Thanks for the abstract 🙂
Jokes apart, I really *can’t* say if the author has taken a “consistent approach” to the question of the length of viewing time because I don’t know how that works in, say, Denmark (some countries *do* split the broadcast in smaller units to highlight the average of the last hour, although the full product may last 3-4 hours); besides, I’m pretty sure that what he’s saying about Spain isn’t quite right (1- to 2- hour broadcasts evaluated to assess the audience): there’s some variability depending on channels, which I’m not going to discuss here, but most of the time the typical observed time span is 2h30′.
All that said, I was correcting myself for having said that the author “didn’t even look aware of the problem”, while he dedicates at least a whole page to discuss that. I still can’t be sure about the second part of my sentence, but the first one was totally off the mark, and that’s why I felt the need to apologise.
However the rest of your recap is *the point*, especially since the “historical perspective” the author uses to shape his conclusion suddendly excludes Italy and Spain (and Denmark) replacing them with USA, a methodological decision which drives the results pretty much in a specific direction. The reported 0.64 M loss is easily covered by the increase of viewing figures in Italy and Spain.
The fact that the specific stage by stage analysis is focused on 2014 Tour makes the misreading of the Italian data even worse, obviously enough.
I’d dare to say that, even narrowing the scope only to those same eight countries, only stage 3 does perhaps remain below the 8 M mark – and we must consider it was a Monday. A relevant number of stages would hit the 10 M mark and others would easily pass the 12 M mark.
Finally, I can’t see the table where the assumed viewing figures of the Giro should appear, it’s on an undisclosed page, but I’m afraid that this same mistake could produce huge consequences and a subsequent misinterpretation.
Thanks Gabriele for your extensive comments. You seem very knowledgeable in the field of TV ratings. Could you please send me an e-mail so that we can discuss this a bit more in detail? I cannot post my mail address on this website, but you can find it in the book (chapter), or you can send a mail to inrng.com.
It’s great to see that a single quote in a book review can stir up such a discussion. That’s exactly what we wanted to realise with the book: create some more discussion on many different aspects of this wonderful sport so that everybody (including the authors) can learn from this and bring professional road cycling to another level.
Regarding the ‘6 million quote’:
– your criticism on the Italian data is entirely correct and well founded. When the article was written early in 2015, I only had data on one Italian TV station and assumed (wrongly) this was the complete Italian tour de France audience. I found out during this year’s Tour de France that the Italian situation was much more complicated with multiple broadcasts on different channels. Unfortunately, this could not be changed in the book since the deadline had passed.
– While I agree that the data for Italy are an underestimation of the real Italian TV audience, I am very sure about the data for the other 7 countries. They are usually first hand data from TV broadcasters or from websites that publish the actual TV ratings (no blog websites or press articles). Only for France, I also use second hand data.
– The ‘6 million’ mentioned in the book review is approximative and based on the data in a figure. It is not a real statement made by me in the book chapter. In fact, the actual number for the lowest watched stage in 2014 in those 8 countries was not 6 million, but almost 10% more: 6,5 million. And half a million makes a big difference: it is the combined audience of Denmark and Australia.
– As I explained in the chapter, many different concepts are used for describing TV audiences so that for a single sports event reported TV audiences can differ by factor two or three depending on the concept used (average audience, peak audience, reach). Regarding ‘share’: I prefer to use total population as the reference and not total viewers because (and also this is explained in the book) this allows a much better comparison across time and across countries. The total population of a country is more or less constant while the total number of viewers in a country depends on many factors, such as what’s on TV on the other channels (e.g. a very popular movie or another big sports event on a rival channel), the day of the week (more people watch TV during the weekend, e.g. children are at home during the weekend and watch children’s programmes, …), or the weather. I admit share related to viewers is often used by race organisers and by marketeers, but this is mainly for strategic reasons: it’s much nicer to say 40% of the TV viewers watched the Tour de France than to say that 4% of the population watched the Tour de France. But as an academic, I am convinced ‘share’ based on total population is a much better measure.
– FYI: German audience for the Tour in 2014: 0.34 MIO on Eurosport; in 2015: 1,17 MIO on ARD and 0,35 MIO on Eurosport. This is still well below the record audiences in the Telekom/Ullrich years but is, of course, significant. Also interesting: Eurosport kept a steady Tour de France audience despite the broadcasts on ARD. It should be noted though that ARD broadcasts were only one hour long, while the Eurosport broadcasts covered the whole afternoon. Many Germans thus watched the first part on Eurosport and the final on ARD, so you cannot just add these two audiences, as I clearly explained in the book.
Daam, thanks for your reply (and your academic work on cycling which, as I said, I consider deeply interesting and quite necessary). I’ll go and find the email address to get in touch ASAP.
Thanks for the intro. Is there much about the level of public/taxpayer subsidy of the sport? I get the feeling the sport struggles for financial viability in most markets and a distinct lack of blue chip corporate involvement. Still very much a tribal sport.
Such a stark comparison to the Ironman triathlon brand which recently sold for US$650M to its new Chinese owners.
There’s not much on the subsidy aspect but this is a topic to
explore. Many races rely on this even the Tour de France makes its profits with help thanks to payments from municipalities and the other help from police to roads being altered to remove roundabouts. Of course it helps the race happen but the idea is it generates a multiple in return via tourism and promotion. In theory, it’d be good to see the costs vs benefits tested.
The juxtaposition with the Ironman business is quite stark indeed.
Perhaps the main difference being that IM is a mass-participation/high cost event that is focussed on selling spots and running a global series – despite being barely televised. Put aside the nuances of the private equity group who bought/built/sold the WTC and the main theme seems to be that when it comes to the business model; triathlon mainly sells participation; cycling largely sells viewing (making a big generalisation there – but triathlon is the pink unicorn of TV viewing…). Couple this with the persistent stereotype of triathletes as gear-happy shoppers and triathlon seems to be the more financially sound market despite its apparent position as a relatively niche sport.
Gabriele – to my eternal shame, I’m not a progressive rock artist, but if I was my next album would definitely be called ‘Comparable Fatuities”.
I think your comments are actually pretty incisive without access to the book. Re. TV viewing figures I think we all have to accept that they are flawed, but at least they are fairly consistently flawed and can provide a useful baseline for comparison, if nothing else.
Absolutely so. What we need is that they’re kept as consistent as possible, and the least flawed we can achieve. Unluckily, this didn’t happen in the case of Italian figures. I’d like to stress that I know that it wasn’t easy – and things like this happen on a daily basis. Still, the distortion introduced is highly relevant, especially since it has been applied to the 2014 edition as a case study and, above all, it kind of legitimates the final shift in the sample of examined countries.
I’m glad you are putting the royalties from our Prendas purchases to such good use. I’m also grateful to you fire the time you are spending reading this stuff. Any time you need a pithy summary of my area of research (maternity pay deficits and sickness absence rates in UK education, since you ask) just let me know! ?
I was lucky to get an electronic copy for review. Who knows, after this perhaps workplace sickness and absence does have a crossover to sport?
Many thanks to Gabriel on this occasion for spending some time trawling through viewing numbers in selected areas to try and understand where the author might be in error.
It is a fundamental requirement of academic research that findings published can be substantiated, and represent a true set of values. It appears in this case, that the data has been selected from a restricted data set which in itself might be incorrect, incomplete or both in some respects. I am in no way looking to blame the author, but I think it is important that this sort of research should be seen to be absolutely correct and above question. How is the sport to move on if fundamental information is incorrect. If the author is able to substantiate his claims, then I would be the first to accept them as they stand. For now I have serious reservations concerning their validity.
INRNG please do not accept Mendip 500os kind offer a summary for his research topic !
One would assume, as an academic work, this all has been subjected to peer review? As to what it all means to the SPORT of pro cycling is another question. During the history of pro cycling, how prevalent is a pure business model in the decision on team sponsorship? In the beginning the bike industry was all-in to no surprise, but does this book discuss this subject? For more recent fans of the sport I think the era that began with LeMond’s success and continued through the BigTex years has (wrongly) defined the sport as a wonderful advertising value/opportunity for multi-national corporations. Coca-Cola, Nike, Nestle, etc. have no passion for the sport and when it no longer served their business purposes, they left.
I think the most healthy thing to do is to admit that cycling is a niche sport, but that this fact does not actually mean that the sponsors don’t get their money’s worth. Mainly because the value of marketing is way higher than most people comprehend.
If you have a look on discussions and speculations around the new team Thor Hushovd is trying to set up for the 2017-season, it clearly demonstrates the values we are talking about:
Since his retirement, Hushovd has been employed as an ambassador for the Norwegian supermarket chain Rema 1000. Rema 1000 is based mainly in Norway and Denmark, which is a potential market of about 10 mill people. Now heres the interesting part; Their yearly budget on marketing is roughly € 50.000.000 (not including discounts, depending also on exchange rates).
So, if the chain decided to put about half of their budget into a cycling team, the team’s budget would not be that far from Sky’s (ca 25′ GBP source:inrng) or at least they could afford a team like Ag2R (€13 mill, source: inrng). And that’s with a sponsor only targeting Norway and Denmark.
Now that’s not going to happen as alternative costs are too high (I’m sure Rema 1000’s money is spent better elsewhere), but it goes to show that for a major international brand with retail sales like f.ex. Adidas, Nestlé, Red Bull, Vodafone etc. the investment return of sponsoring a top cycling team can be ridiculously high. Now with the return of the German market and Lidl’s entry to the sport with Quickstep, it is not outrageous to speculate that a fully sponsored Lidl-team wins the Tour de France within the next 5 years.
As for Hushovd’s team, the general discussion has been about if Norway has a company big enough that it makes sense to sponsor a world tour team. Of course Rema 1000 racing the TDU is a waste of money, but the synergy effect of sponsoring the “National team” competing at the TdF could add a lot of value. The rumors for main sponsor have been DNB (bank), Norwegian (airline), Statoil (who already sponsors the artic tour) or some of the salmon producers.
But in the end, it seems to me that the decisions made around sponsorship in cycling is more often than not made without the marketing value in mind. For example, It’s been a while since I last bought some of Lampre’s pre-coated steel or anything from Orica’s explosives catalogue.
Come to think of it….why aren’t red bull sponsoring a team? I think they do bmx, but red bull generally sponsor a few niche sports and sponsor a lot of racing in cars, planes, motorbikes etc. Is cycling just that toxic red bull won’t go near it?
Red Bull tend to pair up with sports that are deemed more high-adrenaline
I doubt its anything to do with doping
That’s right. They sponsor some MTB and look up Red Bull Road Rage for their brand’s take on road cycling. Traditional cycling which takes six hours a day and up to three weeks to settle isn’t for them.
Good points. A reminder that for all we see Team Sky as a big budget team, it represents about 1% of Sky’s marketing budget for the UK and Ireland.
Yeah, Sky has done so good. And I don’t know about other countries, but their big in Italy as well.
A good thought experiment is if the investment return ratio is even better for a pro-conti team with a “guaranteed” TdF invitation, like f.ex. Cofidis. Though it’s hard to calculate the difference in value of actually winning or just being in breaks. I guess a good approach would be “How cheaply can you get a team into the TdF on a regular basis?”
In the end, it seems like you need at least € 10 mill to participate, and I would think another € 15 mill for winning the thing is worthwhile the risk. Also, there is a distinct difference between new and established cycling countries. If Team Sky rode like Cofidis I find it hard to believe the “British cycling revolution” would ever have happened, while on the other hand a small Spanish sponsor could bet a lot of good exposure just “animating” the race.
Anyway, keep going with these kind of articles, Inrng! These articles are unique and I can’t think of anyone else supplying them. Good job finding a niche within a niche sport!
Thanks to all contributors and the author contribution. This was – yet another – great discussion to read. Gladly support INRNG for this sort of work and discussion.
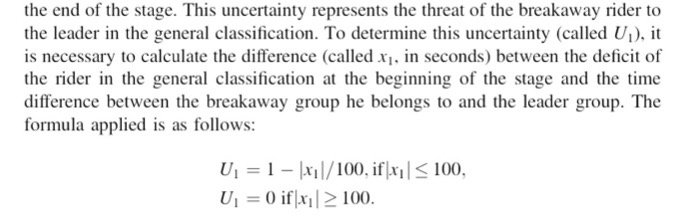
The maths you’ve quoted is very slightly wonky. U1 has a discontinuous definition, and the conditional definitions are qualified with ≤ 100 and ≥ 100. 😉